Final project
Due by 11:59 PM on Sunday, May 4, 2025
You made it to the end of our whirlwind tour of data visualization principles! Congratulations!
Now you get to show off all the tools you learned with a beautiful, truthful, narrative visualization.
For your final project, you will take a dataset, explore it, tinker with it, and tell a nuanced story about it using at least three graphs.
I want this project to be as useful for you and your future career as possible—you’ll hopefully want to show off your final project in a portfolio or during job interviews.
Accordingly, you have total freedom in what data you can use for this project. Go to this list of data sources and find something interesting, or use your own data. Do something neat!
Instructions
Here’s what you’ll need to do:
Download a dataset and explore it. Many of these datasets are large and will not open (well) in Excel, so you’ll need to load the CSV file into R with
read_csv(). Most of these datasets have nice categorical variables that you can use for grouping and summarizing, and many have time components too, so you can look at trends. Your past problem sets and in-class examples will come in handy here.Find a story in the data. Explore that story and make sure it’s true and insightful.
Use R to create at least three graphs to tell the story. You can make as many graphs as you want, but you must use at least three different chart types (i.e. don’t just make three scatterplots or three maps).
Export these figures as PDF files, place them in a vector editing program, and make one combined graphic or handout where you tell the complete story. You have a lot of latitude in how you do this. You can make a graphic-heavy one-page handout. You can make something along the lines of the this, with one big graphic + smaller subgraphics + explanatory text. Just don’t make a goofy infographic. Whatever you do, the final figure must include all the graphics, must have some explanatory text to help summarize the narrative, and must be well designed.
Export the final graphic from Illustrator as a PDF and a PNG.
Write a memo using Quarto to introduce, frame, and describe your story and figure. Use this template to get started. You should include the following in the memo:
- Executive summary
- Background information and summary of the data
- Explanation, description, and code for each individual figure
- Explanation and description for the final figure
- Final figure should be included as an image (remember
)
Remember to follow Quarto etiquette rules and style—don’t have it output extraneous messages or warnings, include summary tables in nice tables, adjust the dimensions for your figures, and remove the placeholder text that’s in the template already (i.e. I don’t want to see stuff like “Describe and show how you cleaned and reshaped the data” in the final report.)
You’ll need to create an RStudio Project folder to organize all your content, just like with all the previous exercises and mini projects.1
You should download a full example of what a final project might look like (but don’t make your final combined visualization look exactly like this—show some creativity!)
Final deliverables
Upload the following files to iCollege:
- A memo introducing and describing your final graphic (see full instructions above)
- A standalone PDF of your graphic exported from Illustrator
- A standalone PNG of your graphic exported from Illustrator
No late work will be accepted for this project since it’s the last project and it counts as your final.
I will use this rubric to grade the final product:
I am happy to give feedback and help along the way—please don’t hesitate to get help! My goal is for you to have a beautiful graphic in the end that you’ll want to show off to all your friends, family, neighbors, employers, and strangers on the street—I’m not trying to trip you up or give you trick questions!
And that’s it. You’re done! Go out into the world now and make beautiful, insightful, and truthful graphics.
Past examples
Download a full example of what a final project might look like.
Here are some great examples of student projects from past versions of this class.
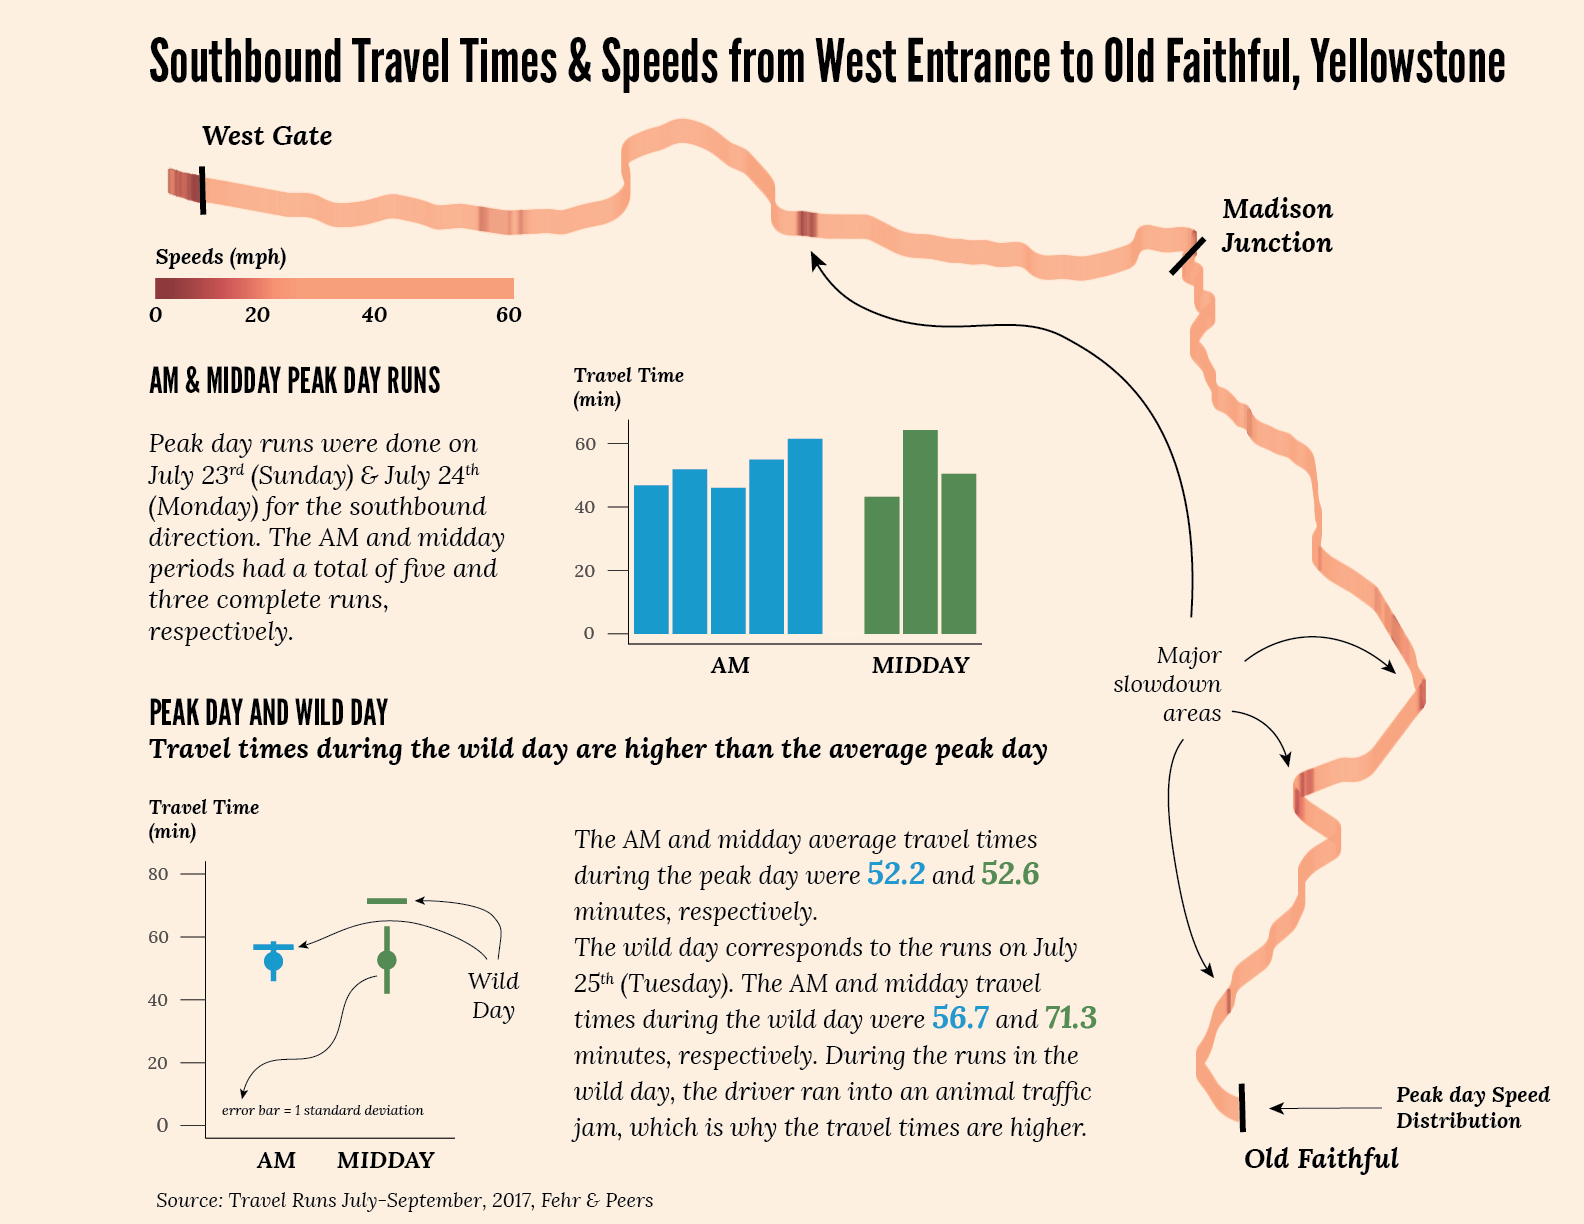
Travel runs in Yellowstone
Project description Final PDF Final PNG
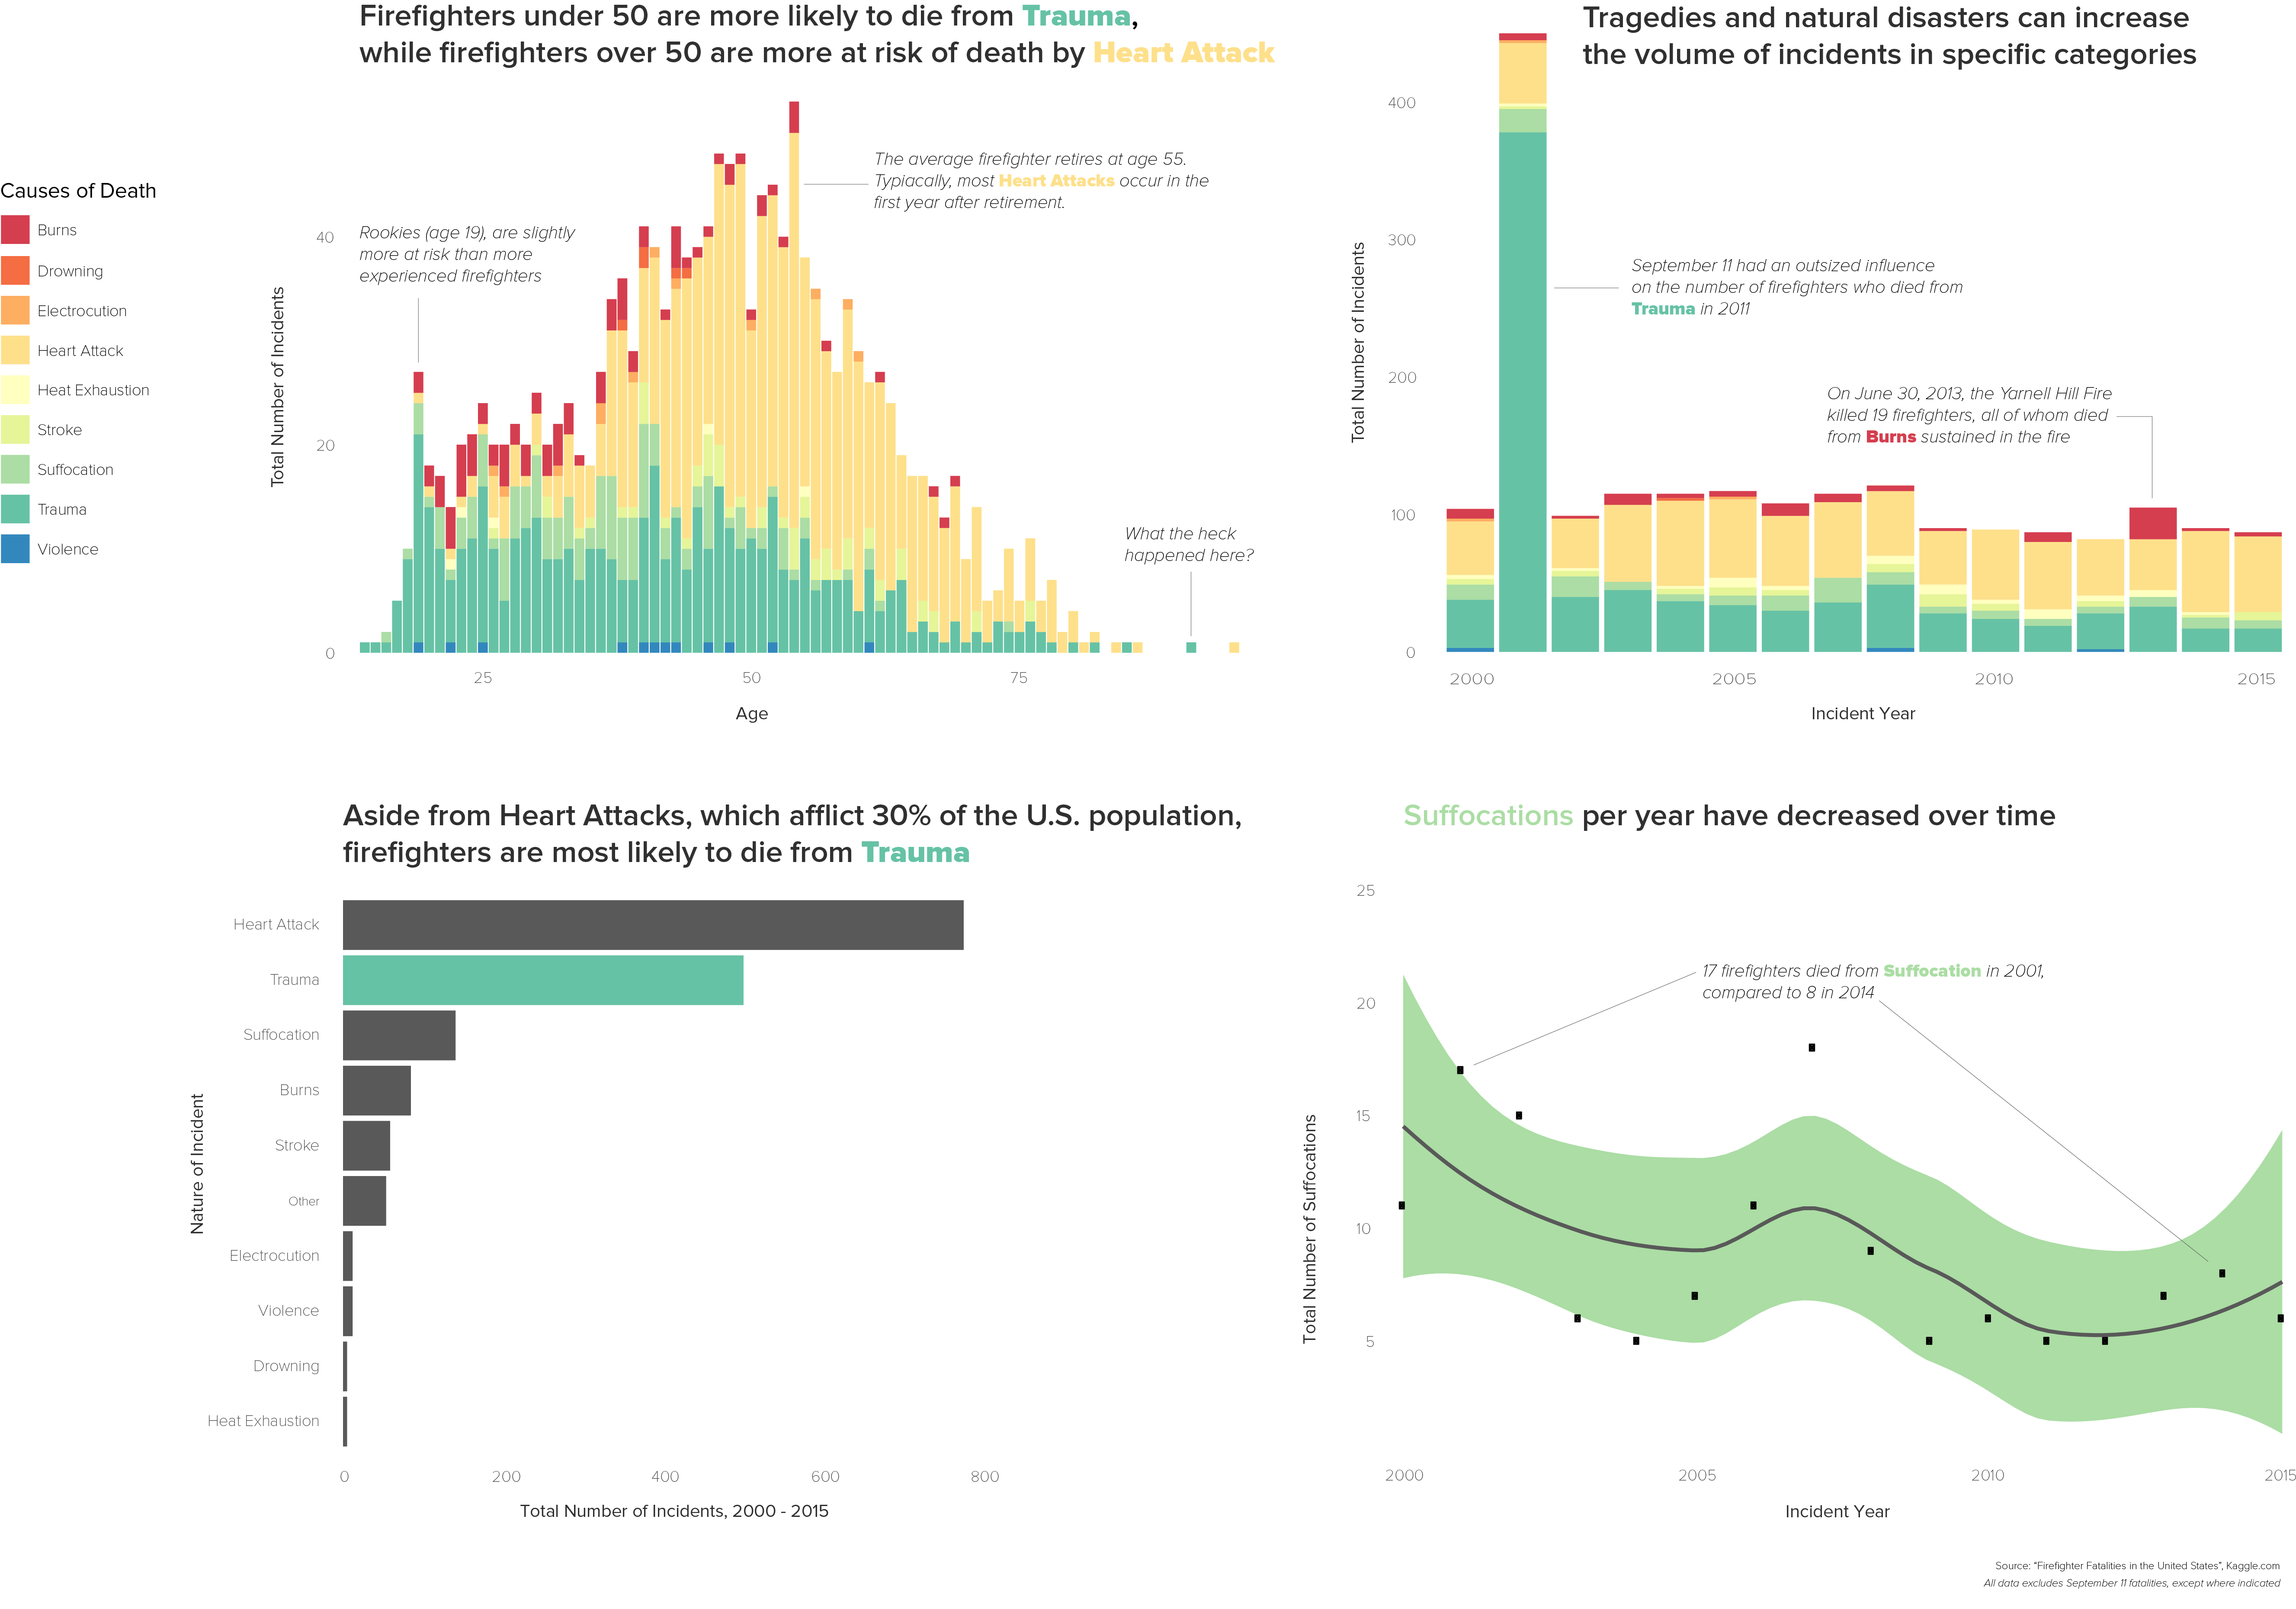
Firefighter fatalities
Project description Final PDF Final PNG
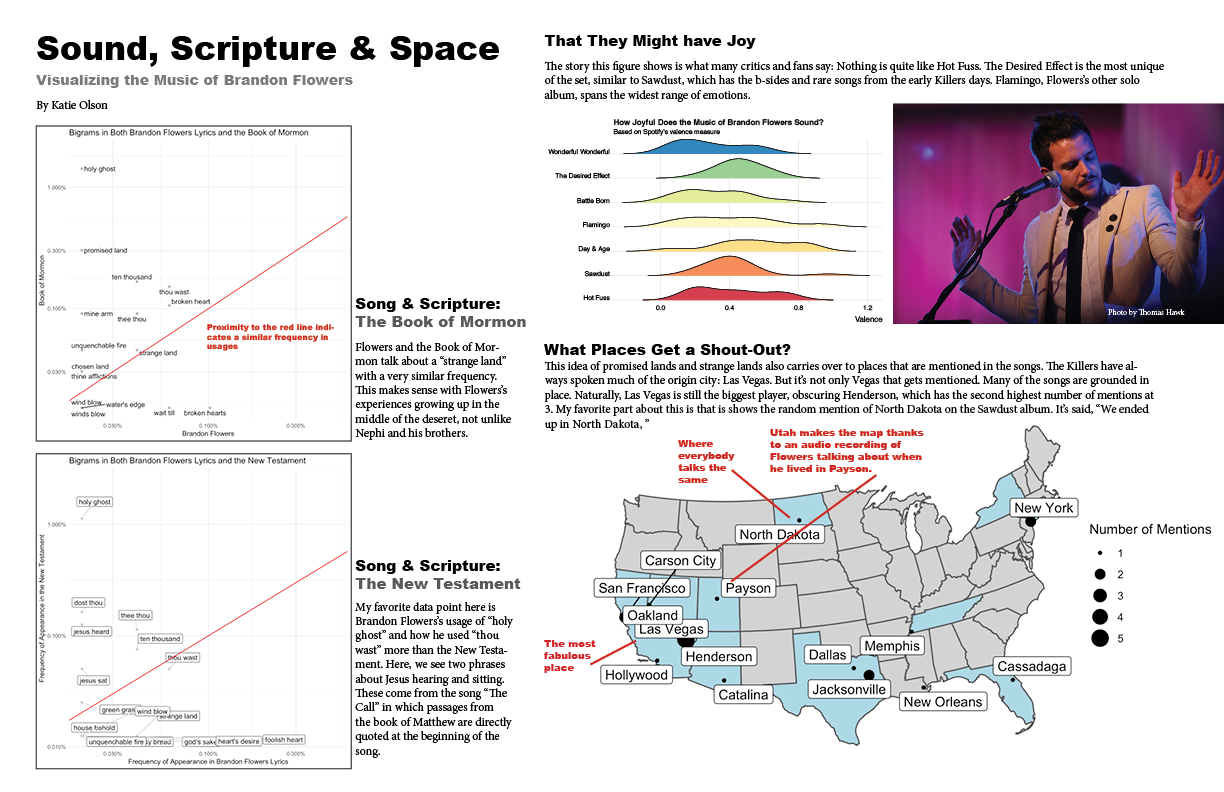
Scripture use by The Killers
Project description Final PDF Final PNG
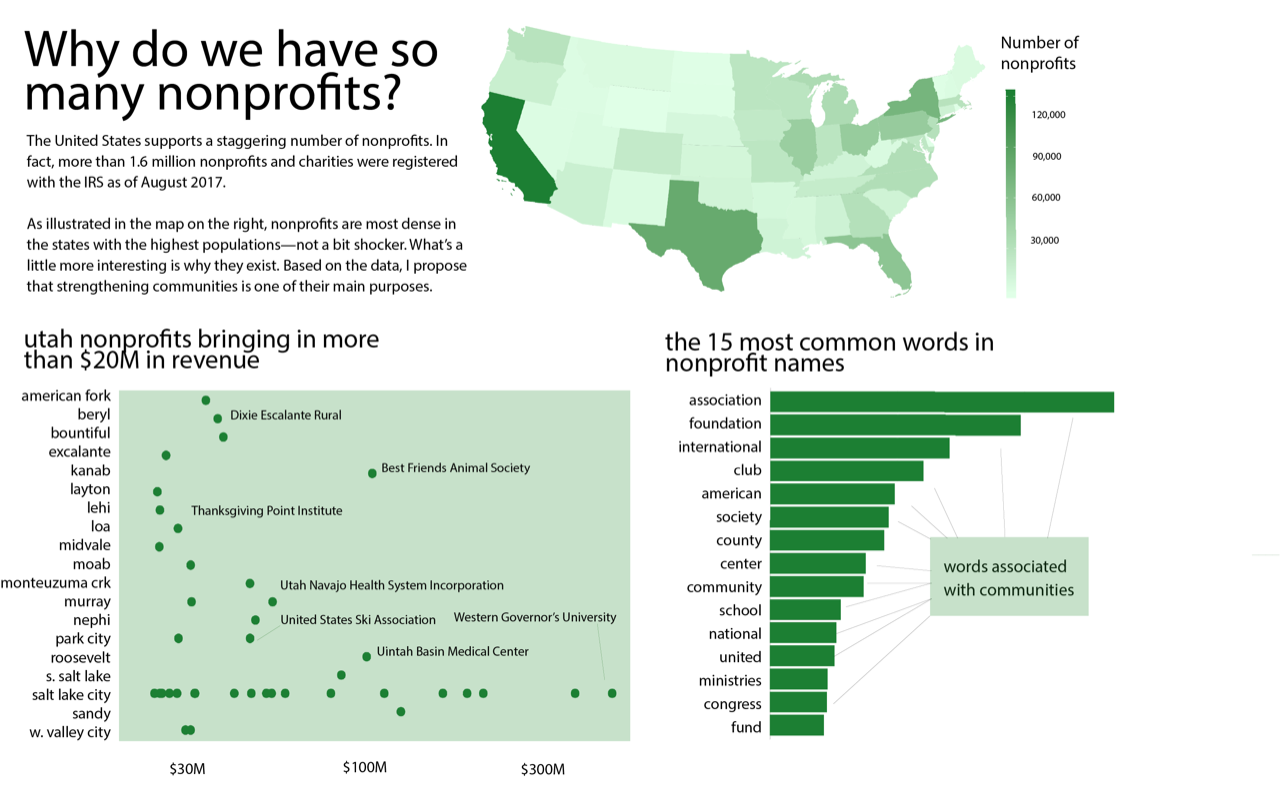
Utah nonprofits
Project description Final PDF Final PNG
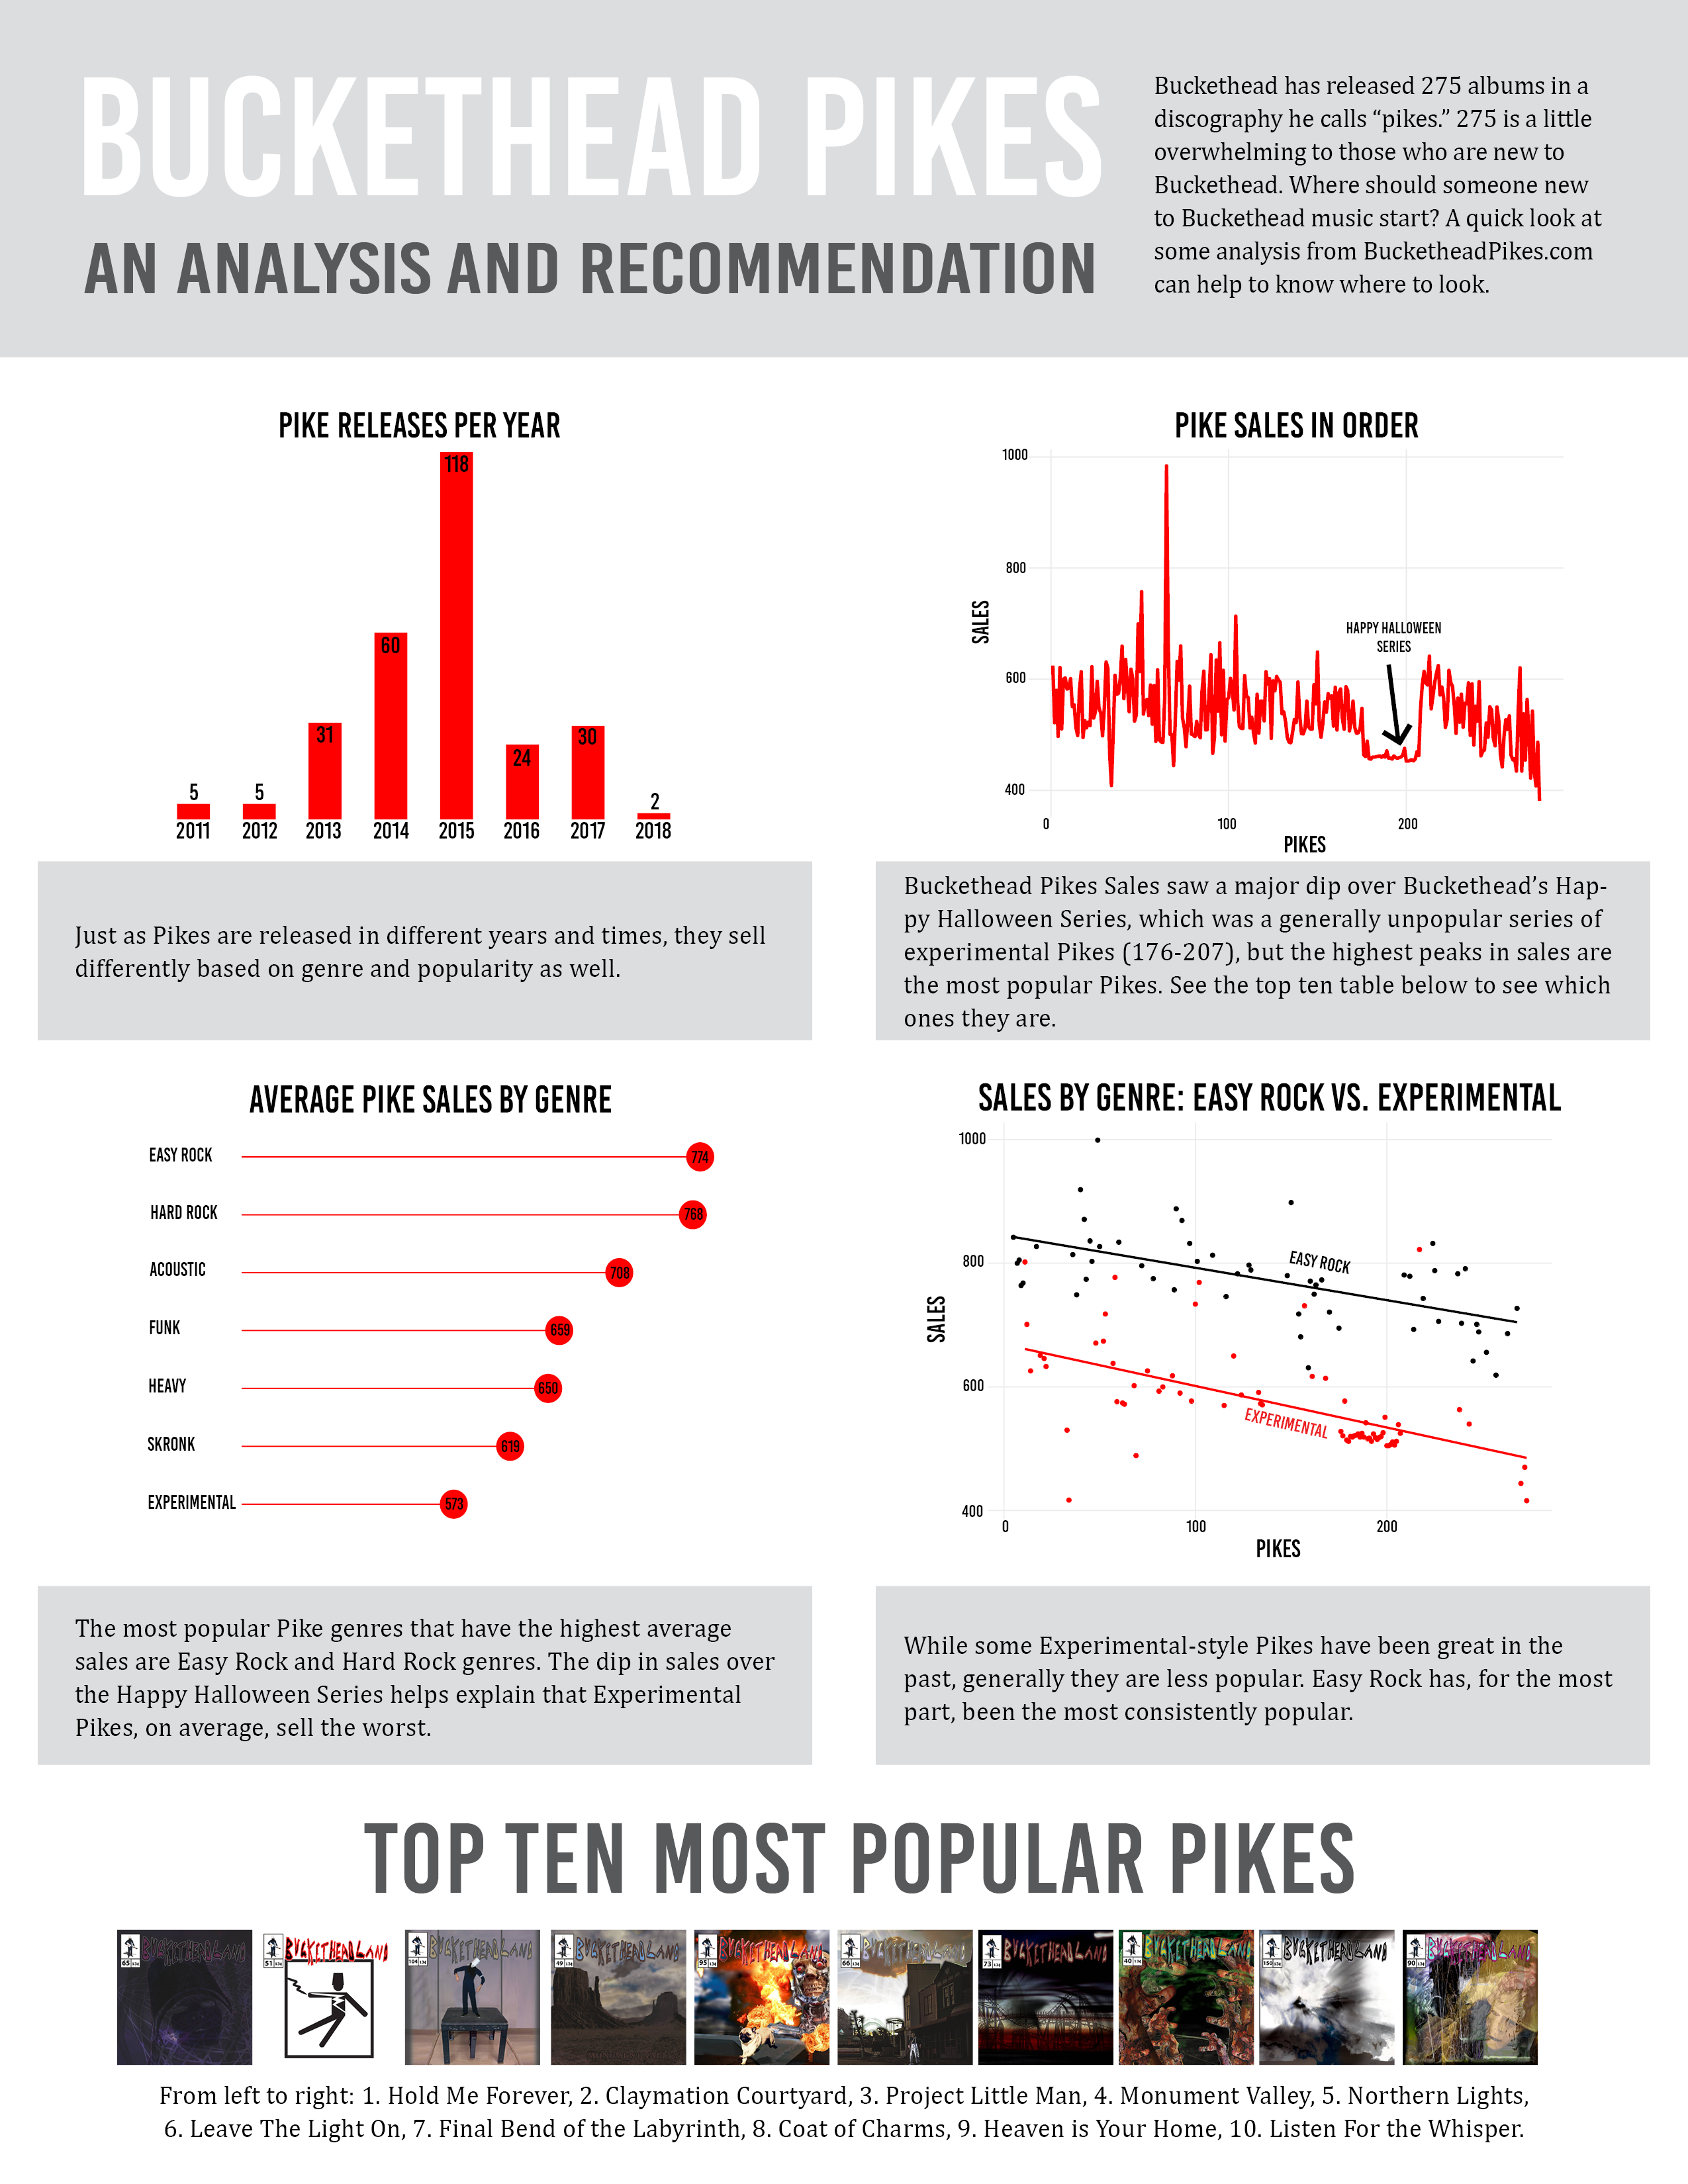
Buckethead
Project description Final PDF Final PNG
Footnotes
There’s also an empty Posit.Cloud project here if you want.↩︎